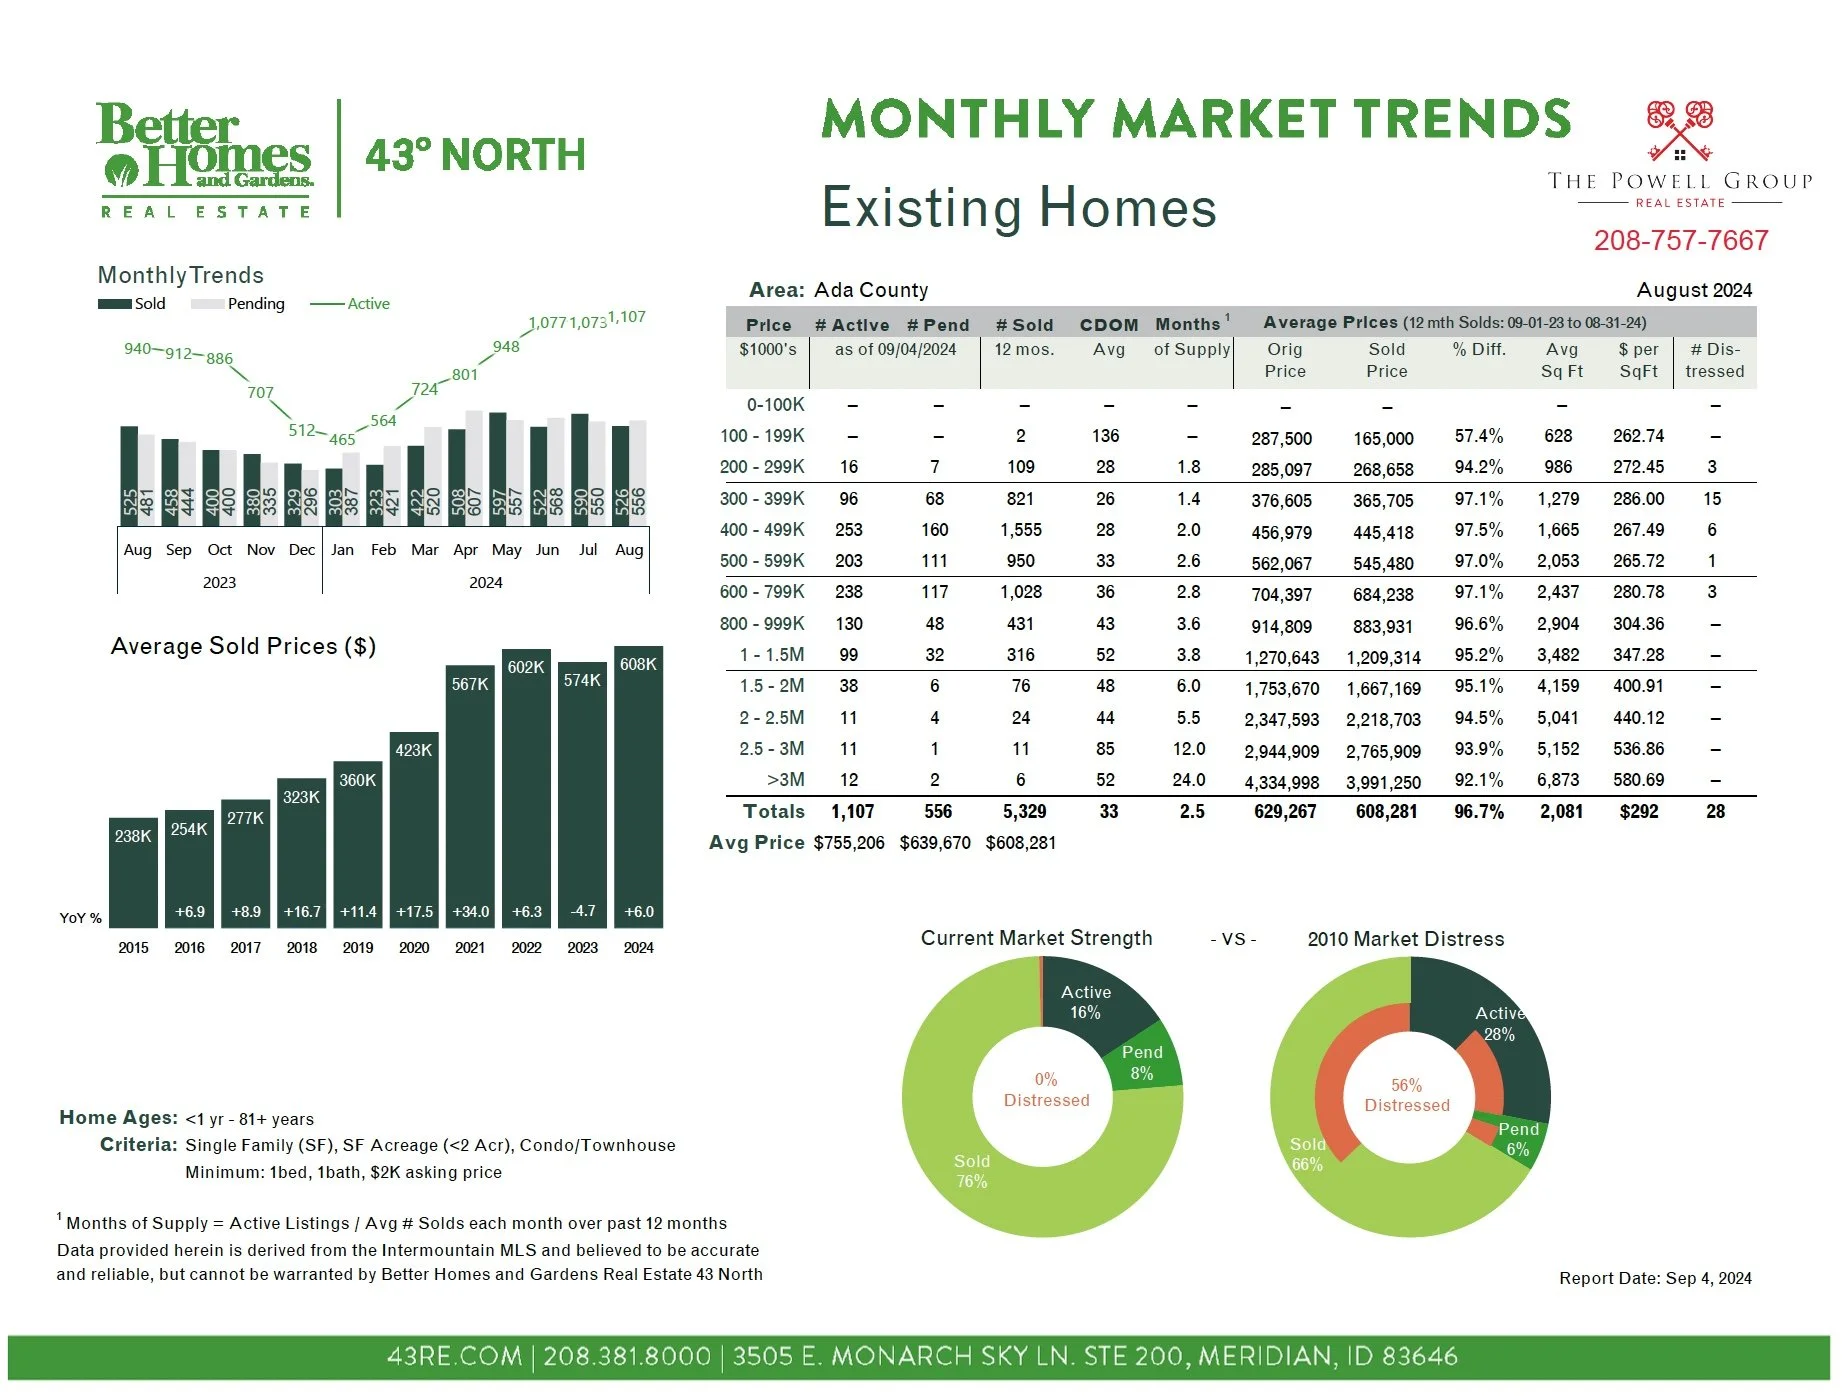
Are you looking for more detailed market stats and reports for the Boise and the Treasure Valley?
We can provide you with reports specific to your area of the Treasure Valley. Be sure to reach out to subscribe.

Are you looking for more detailed market stats and reports for the Boise and the Treasure Valley?
We can provide you with reports specific to your area of the Treasure Valley. Be sure to reach out to subscribe.